
The New York Liberty and Indiana Fever delivered an exciting WNBA matchup on July 18, 2026, at Gainbridge Fieldhouse in Indianapolis. Indiana overcame a double-digit deficit and produced a strong second-half performance to defeat New York 108–88. Kelsey Mitchell led the Fever with 33 points, while Caitlin Clark added 17 points and seven assists. For the Liberty, Breanna Stewart led all New York players with 26 points.
The game offered several important lessons about scoring efficiency, ball movement, turnovers, and defensive adjustments. New York started strongly and held a 13-point lead, but Indiana responded before halftime and took control in the third quarter.
For fans researching New York Liberty vs Indiana Fever match player stats, this breakdown covers the leading scorers, rebounds, assists, shooting numbers, team comparisons, key moments, and fantasy basketball takeaways. It also explains which statistics mattered most in the final result.
1. Game Overview: Liberty vs Fever
The July 18 meeting took place at Gainbridge Fieldhouse in Indianapolis. Indiana entered halftime trailing by four points but delivered a dominant third quarter to turn the game around.
| Game detail | Information |
|---|---|
| Matchup | New York Liberty vs. Indiana Fever |
| Date | July 18, 2026 |
| Venue | Gainbridge Fieldhouse |
| Location | Indianapolis, Indiana |
| Final score | Indiana Fever 108, New York Liberty 88 |
| Top scorer for Indiana | Kelsey Mitchell — 33 points |
| Top scorer for New York | Breanna Stewart — 26 points |
The quarter-by-quarter scoring shows how dramatically the game changed.
| Quarter | New York Liberty | Indiana Fever |
|---|---|---|
| First | 28 | 22 |
| Second | 21 | 23 |
| Third | 12 | 30 |
| Fourth | 27 | 33 |
| Final | 88 | 108 |
New York scored 49 points in the first half and appeared to have control of the game. Indiana, however, tightened its defense and scored 30 points in the third quarter while holding the Liberty to just 12.
The Fever then added 33 points in the fourth quarter to complete the 20-point victory. Their turnaround was built on efficient shooting, improved offensive rhythm, and pressure that disrupted New York’s possessions.
2. Kelsey Mitchell Player Stats
Kelsey Mitchell was Indiana’s leading scorer and one of the most influential players on the court. She finished with 33 points on 10-of-14 shooting, including four three-pointers. She also made nine free throws.
| Statistic | Kelsey Mitchell |
|---|---|
| Points | 33 |
| Field goals | 10-of-14 |
| Field-goal percentage | 71.4% |
| Three-pointers | 4-of-6 |
| Free throws | 9-of-13 |
| Assists | 1 |
| Steals | 1 |
Mitchell’s shooting efficiency was central to Indiana’s comeback. She did not need a high volume of field-goal attempts to reach 33 points because she converted a large percentage of her shots and added points from the free-throw line.
Her four made three-pointers also forced the Liberty to defend farther from the basket. When a guard consistently hits outside shots, defenders must close out more aggressively, creating space for drives and passes to teammates.
Mitchell’s performance was particularly impressive because she had scored 30 points in the Fever’s previous game against Seattle. The 33-point effort gave her consecutive 30-point games for the first time in her career, according to the Associated Press game report.
Key takeaway: Mitchell’s combination of accurate shooting, three-point production, and free throws helped Indiana turn its second-half momentum into a convincing win.
3. Caitlin Clark Player Stats
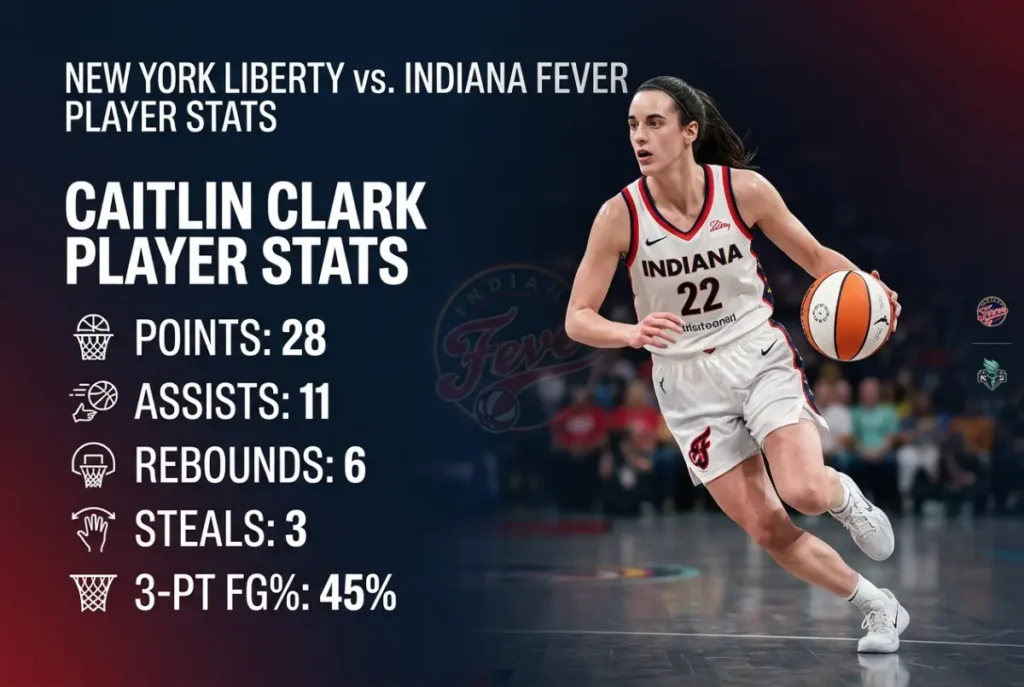
Caitlin Clark contributed 17 points and seven assists in Indiana’s victory. While Mitchell led the team in scoring, Clark helped organize the offense and create opportunities for her teammates.
| Statistic | Caitlin Clark |
|---|---|
| Points | 17 |
| Field goals | 5-of-14 |
| Three-pointers | 2-of-8 |
| Free throws | 5-of-5 |
| Assists | 7 |
| Rebounds | 2 |
Clark’s seven assists were especially important in a game where Indiana scored 108 points. Assists help show how effectively a player creates scoring opportunities for others rather than relying only on individual shooting.
Clark also contributed from the perimeter, making two three-pointers. Although her field-goal percentage was lower than Mitchell’s, she still provided valuable scoring and playmaking.
One key moment came early in the third quarter when Clark converted a three-point play that gave Indiana its first lead of the game. That basket helped mark the shift in momentum after the Fever had reduced New York’s halftime lead.
Clark’s role illustrates why a point guard’s performance should be assessed through more than points alone. Scoring, assists, spacing, decision-making, and defensive attention all influence the team’s overall offensive production.
4. Aliyah Boston Player Stats
Aliyah Boston supplied another important contribution for Indiana, finishing with 15 points, seven rebounds, and four assists. Her work inside gave the Fever a reliable scoring option beyond their perimeter players.
| Statistic | Aliyah Boston |
|---|---|
| Points | 15 |
| Field goals | 6-of-11 |
| Three-pointers | 1-of-2 |
| Rebounds | 7 |
| Assists | 4 |
| Steals | 2 |
Boston’s 15 points helped Indiana maintain scoring pressure across multiple positions. Her seven rebounds also supported the Fever’s work on the glass, helping the team secure possessions and limit second-chance opportunities.
Her four assists showed that she contributed to ball movement as well as finishing plays. Frontcourt players who can pass effectively give an offense more options, especially when guards draw defensive attention.
Boston’s performance complemented Mitchell’s scoring and Clark’s playmaking. Rather than depending on a single player, Indiana received useful production from several starters and rotation players.
5. Indiana Fever Player Stats
Indiana’s scoring was spread across its roster. Mitchell led the team, but Clark, Boston, Sophie Cunningham, and Tyasha Harris also reached double figures.
| Fever player | Points | Rebounds | Assists |
|---|---|---|---|
| Kelsey Mitchell | 33 | 0 | 1 |
| Caitlin Clark | 17 | 2 | 7 |
| Aliyah Boston | 15 | 7 | 4 |
| Sophie Cunningham | 11 | 4 | 1 |
| Tyasha Harris | 11 | 2 | 4 |
| Lexie Hull | 8 | 2 | 2 |
| Myisha Hines-Allen | 5 | 3 | 1 |
| Makayla Timpson | 2 | 5 | 0 |
| Raven Johnson | 2 | 1 | 0 |
Selected Indiana player totals from the game box score; check the official gamebook for complete minutes, shooting splits, and additional statistics.
Sophie Cunningham and Tyasha Harris each scored 11 points, giving Indiana two more double-digit scorers. Their contributions made it more difficult for New York to concentrate its defense on Mitchell and Clark.
Lexie Hull added eight points, while Myisha Hines-Allen provided five points and three rebounds. Bench contributions can become especially important during a comeback because fresh players help maintain energy and defensive intensity.
Indiana’s overall performance reflected a productive team effort: Mitchell supplied elite scoring efficiency, Clark facilitated the offense, Boston contributed inside, and the supporting cast added valuable points.
6. Breanna Stewart Player Stats
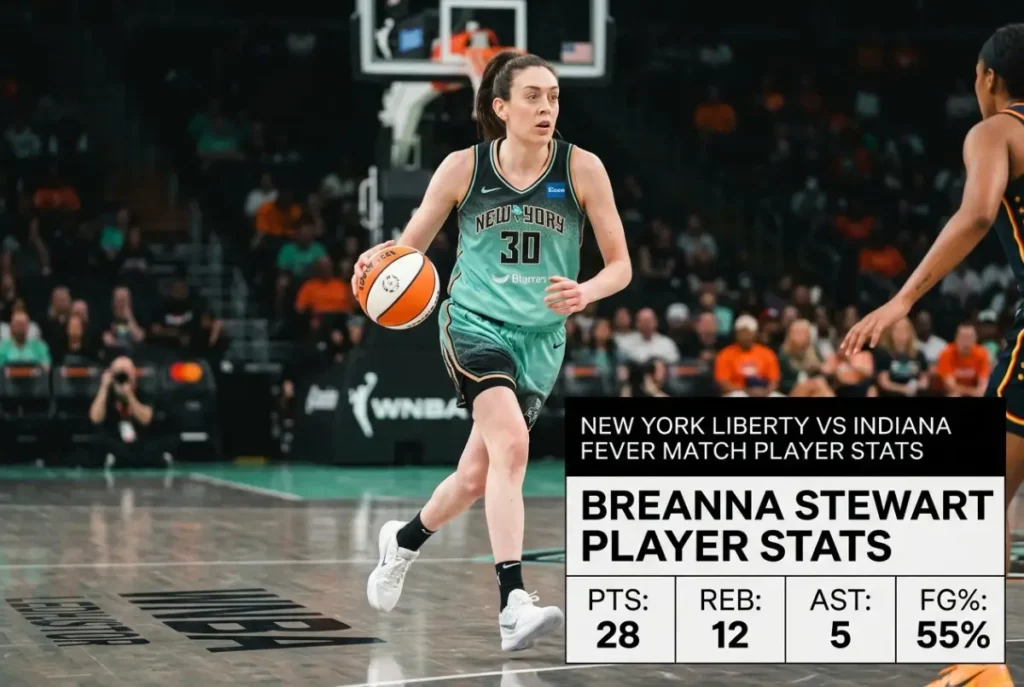
Breanna Stewart led New York with 26 points on 10-of-16 shooting. She also recorded eight rebounds and three assists.
| Statistic | Breanna Stewart |
|---|---|
| Points | 26 |
| Field goals | 10-of-16 |
| Rebounds | 8 |
| Assists | 3 |
| Field-goal percentage | 62.5% |
Stewart was efficient from the field and provided much of New York’s scoring. Her ability to score from different areas makes her an important offensive option, especially when the Liberty need a basket to stop an opposing run.
However, individual efficiency does not always translate into a team victory. Basketball depends on collective performance, and Indiana received more balanced scoring during its second-half surge.
Stewart’s 26 points kept her among the game’s top performers, but New York struggled to sustain its early offensive pace. The team’s 12-point third quarter was particularly damaging because Indiana scored 30 in the same period.
7. Marine Johannes and Other Liberty Contributors
Marine Johannes made an immediate impact, scoring 12 points on 4-of-8 shooting from three-point range. Her outside shooting helped New York establish an early advantage.
Johannes scored all 12 of those points in the opening seven minutes, but she left the game early in the fourth quarter with an ankle injury and did not return, according to the game report. <Cite refs={[“turn924254search0″,”turn924254search6”]}/>
Other Liberty players contributed in different ways. Sabrina Ionescu remained an important part of New York’s offensive setup, while Jonquel Jones provided frontcourt size and rebounding. New York’s rotation was affected by absences, including Leonie Fiebich and Satou Sabally, who did not play in this matchup.
The Liberty’s shooting was not the only factor in their defeat. Their turnovers, particularly during the third quarter, disrupted offensive possessions and allowed Indiana to build momentum.
8. New York Liberty Player Stats
The Liberty had productive individual performances, led by Stewart and Johannes. The following table highlights the main figures reported for the game.
| Liberty player | Points | Key contribution |
|---|---|---|
| Breanna Stewart | 26 | Led New York in scoring and recorded 8 rebounds |
| Marine Johannes | 12 | Made 4 three-pointers before leaving with an ankle injury |
| Sabrina Ionescu | — | Helped organize the Liberty offense |
| Jonquel Jones | — | Provided frontcourt size and rebounding |
The dashes indicate that a specific points total is not included here rather than implying the player scored zero. For complete player-by-player totals, use the official WNBA box score.
Stewart’s scoring helped New York remain competitive, while Johannes’ early shooting provided a strong start. However, Indiana’s third-quarter defense made it harder for the Liberty to generate the same quality of opportunities.
The broader lesson is that individual player stats need to be considered alongside game flow. A player may have a strong first half, but if the team struggles after halftime, those early numbers may not be enough to secure a win.
9. Team Statistics: Liberty vs Fever
The team comparison shows Indiana’s advantage in shooting efficiency, rebounds, and scoring after halftime.
| Team statistic | New York Liberty | Indiana Fever |
|---|---|---|
| Final points | 88 | 108 |
| Field goals | 30-of-67 | 37-of-69 |
| Field-goal percentage | 44.8% | 53.6% |
| Three-pointers | 13-of-32 | 14-of-28 |
| Three-point percentage | 40.6% | 50.0% |
| Free throws | 15-of-25 | 20-of-27 |
| Total rebounds | 39 | 47 |
| Assists | 19 | 22 |
| Turnovers | 15 | 16 |
Team totals are based on the published game box score. Individual rebounds may differ in secondary summaries, so the official box score should be used for final statistical verification.
Indiana made seven more field goals than New York and shot nearly nine percentage points better from the field. The Fever also made half of their three-point attempts, compared with about 41% for the Liberty.
New York actually committed one fewer turnover overall, so turnovers alone do not explain the final result. The timing of those mistakes mattered: the Liberty committed nine turnovers in the third quarter, when Indiana outscored them 30–12.
Indiana also recorded more assists and rebounds. Those figures support the view that the Fever improved their team execution as the game progressed.
10. How Indiana Turned the Game Around
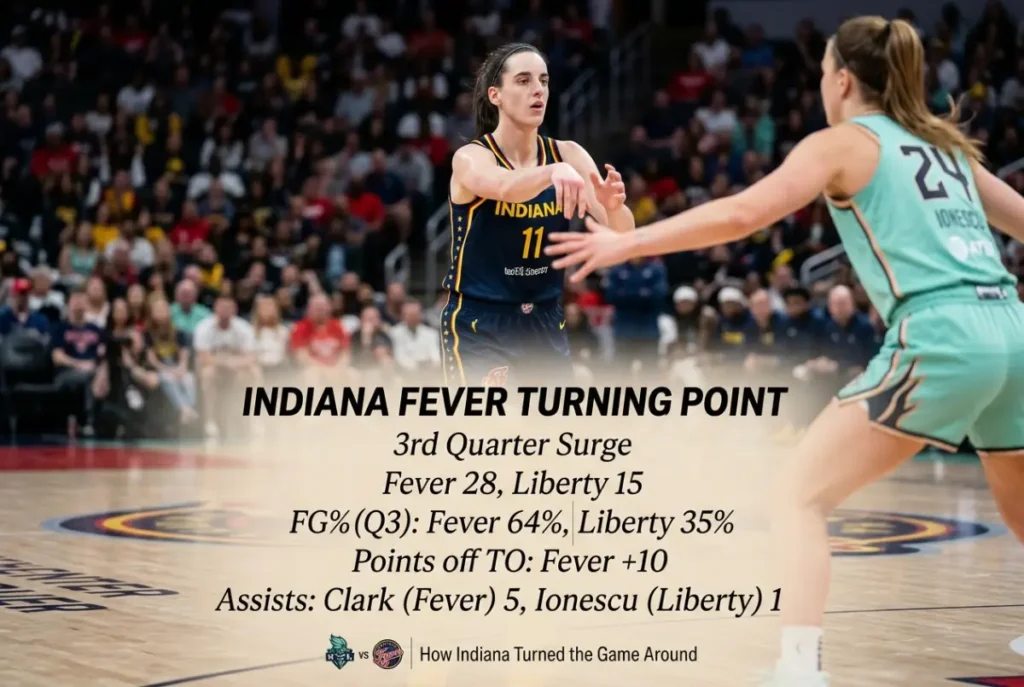
Indiana’s comeback was the defining story of the matchup. New York built a lead of as many as 13 points, but the Fever gradually reduced the gap before halftime.
A 13–3 run late in the second quarter helped Indiana close the score to 49–45 at the break. The Fever then took their first lead early in the third quarter when Clark completed a three-point play.
The third quarter changed everything. Indiana scored 30 points, while New York managed only 12. The Fever’s pressure contributed to nine Liberty turnovers during that period, allowing Indiana to gain momentum and create more scoring opportunities.
Indiana did not let up in the fourth quarter, scoring another 33 points. New York scored 27, but the deficit had grown too large to overcome.
The turnaround illustrates three important basketball principles:
- Shooting efficiency matters: Indiana converted a high percentage of its attempts.
- Ball security matters in key stretches: New York’s third-quarter turnovers interrupted its offense.
- Momentum must be sustained: Indiana continued scoring after taking the lead instead of allowing the Liberty to recover.
11. Three-Point Shooting and Offensive Efficiency
Three-point shooting was one of Indiana’s biggest advantages. The Fever made 14 of 28 attempts from beyond the arc, a 50% rate. New York made 13 of 32, or approximately 40.6%.
Although the number of made threes was close, Indiana needed fewer attempts to make more than half of its shots. Efficient three-point shooting can stretch the defense and open space near the basket.
The Fever also made 37 of 69 field goals overall. Their 53.6% field-goal percentage indicates that the team converted its opportunities at a strong rate.
New York shot 44.8% from the field. That percentage is not inherently poor, but the difference was significant in a game where Indiana scored 20 more points.
Free throws added another factor. Indiana made 20 of 27, while New York converted 15 of 25. The Fever’s additional five made free throws contributed to the scoring gap.
12. Rebounds, Assists, and Turnovers
Rebounding, passing, and turnovers can reveal why one team controls a game even when both teams have capable scorers.
Indiana finished with 47 total rebounds compared with New York’s 39 in the published team comparison. More rebounds can provide additional possessions and reduce the opponent’s opportunities for second-chance points.
The Fever also recorded 22 assists, three more than the Liberty. Assists generally reflect successful ball movement and the ability to create good shots for teammates. Indiana’s total was consistent with a team that received scoring from several players.
Turnovers require more context. Indiana finished with 16 and New York with 15, so the overall difference was small. Yet the Liberty’s nine third-quarter turnovers were especially damaging because they occurred during the period when the Fever took control.
This is why analysts should review both total statistics and quarter-by-quarter performance. A team may finish with a similar turnover total but suffer more costly mistakes at a crucial point in the game.
13. Fantasy Basketball Takeaways
The matchup offered several useful lessons for fantasy basketball players. However, a single game should not be treated as a guarantee of future performance.
Kelsey Mitchell: Her 33 points on 10-of-14 shooting showed how efficient scoring can produce a high-value fantasy performance. Three-pointers and free throws added to her total.
Caitlin Clark: Clark’s 17 points and seven assists demonstrate why playmaking matters in fantasy formats that reward assists as well as scoring. Her overall value may also depend on rebounds, steals, turnovers, and three-pointers.
Aliyah Boston: Boston’s 15 points, seven rebounds, and four assists provided contributions across multiple categories.
Breanna Stewart: Stewart’s 26 points and eight rebounds made her New York’s leading statistical performer.
Marine Johannes: Her 12 points and four made threes showed the value of perimeter shooting, although her early exit with an ankle injury was an important development from that game.
For future fantasy decisions, check current injury reports, expected minutes, recent usage, and the next opponent. Historical player stats provide useful context, but current role and availability are more important when predicting future production.
14. What the Result Means for Future Matchups
Indiana’s win showed that the Fever could recover from a slow start by improving their defensive pressure and shooting efficiency. Mitchell’s scoring, Clark’s playmaking, and Boston’s inside production gave Indiana a balanced offensive foundation.
For New York, the main areas to review are third-quarter execution, turnover control, and maintaining offensive rhythm after halftime. The Liberty’s first-half scoring showed that they could create opportunities, but their 12-point third quarter left too much ground to recover.
Future meetings may look different depending on player availability, lineup changes, and game conditions. One result should not be used to predict every later matchup, but it does provide a clear example of how defensive adjustments and shot-making can change a game.
15. Frequently Asked Questions
Who won the latest matchup covered in this article?
The Indiana Fever defeated the New York Liberty 108–88 on July 18, 2026, at Gainbridge Fieldhouse in Indianapolis.
Who scored the most points?
Kelsey Mitchell led Indiana with 33 points. Breanna Stewart was New York’s leading scorer with 26 points.
How many points did Caitlin Clark score?
Clark scored 17 points and recorded seven assists.
How did Breanna Stewart perform?
Stewart scored 26 points on 10-of-16 shooting and recorded eight rebounds and three assists.
What was the biggest turning point?
Indiana’s third-quarter performance was the biggest turning point. The Fever outscored the Liberty 30–12 during that period.
Which team shot better from three-point range?
Indiana shot 50% from three-point range, making 14 of 28 attempts. New York made 13 of 32, shooting 40.6%.
Where can I find the full box score?
The official WNBA box score provides player and team statistics. The Indiana Fever game recap also covers the comeback and key performances.
Conclusion
The July 18, 2026, game between Indiana and New York showed how quickly a WNBA matchup can change. The Liberty built a double-digit lead, but the Fever responded with efficient shooting, stronger execution, and a dominant third quarter to win 108–88.
Kelsey Mitchell led the way with 33 points, Caitlin Clark contributed 17 points and seven assists, and Aliyah Boston added 15 points. Breanna Stewart led New York with 26 points, but the Liberty struggled to maintain their first-half momentum.
For readers looking up New York Liberty vs Indiana Fever match player stats, the most important details are the scoring leaders, shooting percentages, rebounds, assists, and the dramatic third-quarter shift. Reviewing those numbers together gives a much clearer picture of why Indiana won and which performances defined the game.

Hobby & Animal Names
Leo Hartman has owned dogs, birds, and one very difficult goat. He writes the hobby and animal names content here. Before any name makes the list, he tries it out loud first, usually on his dog, to see if it actually sounds right.